
class 11 maths ncert solutions chapter 6 || ncert solutions for class 11 maths chapter 6 || exercise 6.3 class 11 maths solutions || class 11 chapter 6 exercise 6.3 solution || class 11 maths exercise 6.3 solutions || ncert exemplar class 11 maths || class 11 ch 6 exercise 6.3 solutions || linear inequalities class 11 ncert solutions
Exercise 6.3
1. Solve the following system of inequalities graphically: \(x \geq 3, y \geq 2\)
Answer
\(x \geq 3 \ldots(1)\)
\(y \geq 2 \ldots(2)\)
The graph of the line, \( x=3 \) and \( y=2 \) are drawn the figure below;
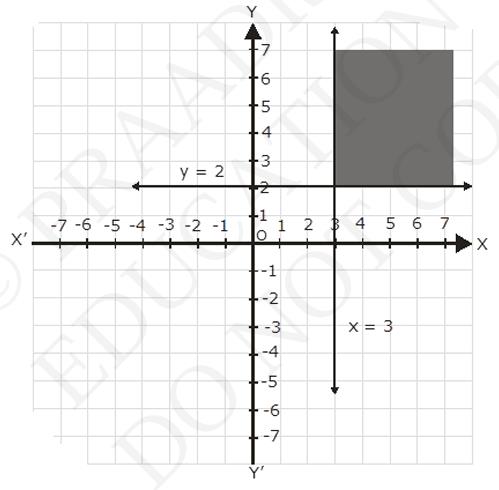
Inequalities (1) represents the region on the right hand side of the line, \( x =3 \) (including the line \( {x}=3 \))
Inequalities (2) represents the region above the line, \( y=2 \) (including the line \( y=2 \))
Hence, the solutions of the given system of linear inequalities is represent by the common shaded including the point on the respective lines as follows.
2. Solve the following system of inequalities graphically: \(3 {x}+2 {y} \leq 12, {x} \geq 1, {y} \geq 2\)
Answer
\(3 x+2 y \leq 12 \ldots(1)\)
\(x \geq 1 \ldots(2)\)
\(y \geq 2 \ldots(3)\)
The graph of the line, \( 3 x+2 y=12, x=1 \) and \( y=2 \) are drawn the figure below;
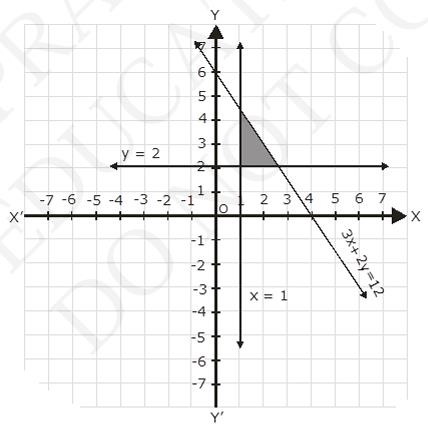
Inequalities (1) represents the region below the line, \( 3 x+2 y=12 \) (including the line \( 3 {x}+2 {y}=12 \))
Inequalities (2) represents the region on the right hand side of the line, \( x \) \( =1 \) (including the line \( {x}=1 \))
Inequalities (3) represents the region above the line, \( y=2 \) (including the line \( y=2 \))
Hence, the solutions of the given system of linear inequalities is represent by the common shaded including the point on the respective lines as follows.
3. Solve the following system of inequalities graphically: \(2 x+y \geq 6,3 x+4 y \leq 12\)
Answer
\(2 x+y \geq 6 \ldots(1)\)
\(3 x+4 y \leq 12 \ldots(2)\)
The graph of the line, \( 2 x+y=6 \), and \( 3 x+4 y=12 \) are drawn the figure below;
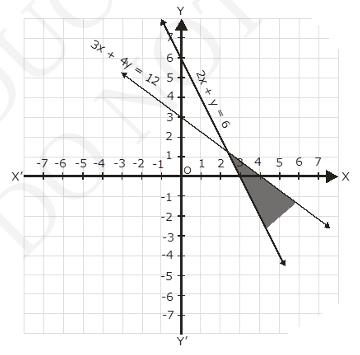
Inequalities (1) represents the region above the line, \( 2 x+y=6 \) (including the line \( 2 x+y=6 \))
Inequalities (2) represents the region below the line, \( 3 x+4 y=12 \) (including the line \( 3 x+4 y=12 \))
Hence, the solutions of the given system of linear inequalities is represent by the common shaded including the point on the respective lines as follows.
4. Solve the following system of inequalities graphically: \(x+y \geq 4,2 x-y < 0\)
Answer
\(x+y \geq 4\)
\(2 x-y < 0\)
The graph of the line, \( x+y=4 \), and \( 2 x-y=0 \) are drawn the figure below;
Inequalities (1) represents the region above the line, \( x+y=4 \) (including the line \( {x}+{y}=4 \))
Inequalities (2) represents the region above the line, \( 2 x-y=0 \) (including the line \( 2 {x}-{y}=0 \))
Hence, the solutions of the given system of linear inequalities is represent by the common shaded including the point on the respective lines as follows.
class 11 maths ncert solutions chapter 6 || ncert solutions for class 11 maths chapter 6 || exercise 6.3 class 11 maths solutions || class 11 chapter 6 exercise 6.3 solution || class 11 maths exercise 6.3 solutions || ncert exemplar class 11 maths || class 11 ch 6 exercise 6.3 solutions || linear inequalities class 11 ncert solutions
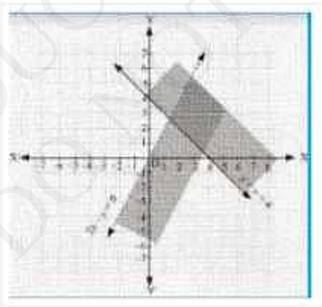
5. Solve the following system of inequalities graphically: \(2 {x}-{y} > 1, {x}-2 {y} < -1\)
Answer
\(2 x-y > 1 \ldots(1)\)
\(x-2 y < -1\)
The graph of the line, \( 2 x-y=1 \), and \( x-2 y=-1 \) are drawn the figure below;
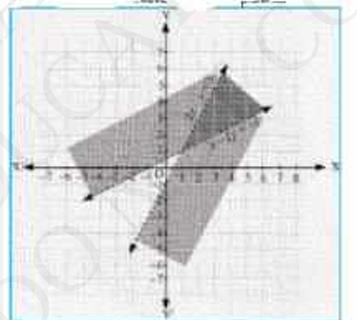
Inequalities (1) represents the region below the line, \( 2 x-y=1 \) (including the line \( 2 {x}-{y}=1 \))
Inequalities (2) represents the region above the line, \( x-2 y=-1 \) (including the line \( {x}-2 {y}=-1 \))
Hence, the solutions of the given system of linear inequalities is represent by the common shaded including the point on the respective lines as follows.
6. Solve the following system of inequalities graphically: \(x+y \leq 6, x+y \geq 4\)
Answer
\(x+y \leq 6 \ldots(1)\)
\(x+y \geq 4 \ldots(2)\)
The graph of the line, \( x+y=6 \), and \( x+y=4 \) are drawn the figure below;
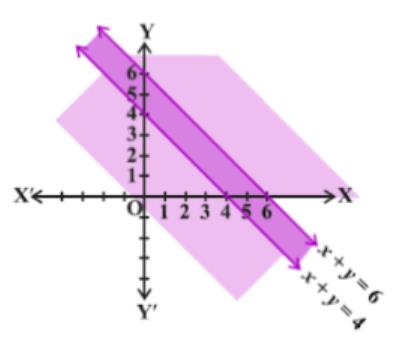
Inequalities (1) represents the region below the line, \( x+y=6 \) (including the line \( x+y=6 \))
Inequalities (1) represents the region above the line, \( x+y=4 \) (including the line \( x+y=4 \))
Hence, the solutions of the given system of linear inequalities is represent by the common shaded including the point on the respective lines as follows.
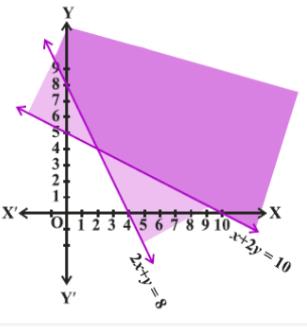
7. Solve the following system of inequalities graphically: \(2x + y \geq 8, x + 2y \geq 10\)
Answer
Given \(2x + y \geq 8\)
Putting value of \(x = 0\) and \(y = 0\) in equation one by one, we get value of
\(y = 8\) and \(x = 4\)
The required points are (0, 8) and (4, 0)
Checking if the origin is included in the line as graph \((0, 0) 0 \geq 8,\) which is false.
Hence, the origin is not included in the solution area and the required area would be the area to the right of the line’s graph.
\(x + 2y\geq 10\)
Putting value of \(x = 0\) and \(y = 0\) in equation one by one, we get value of
\(y = 5\) and \(x = 10\)
The required points are (0, 5) and (10, 0)
Checking for the origin (0, 0)
\(0 \geq 10\) which is false,
Hence the origin would not lie in the required solution area. The required area would be to the left of the line graph.
The shaded area in the graph is the required solution of the given inequalities.
8. Solve the following system of inequalities graphically: \(x+y \leq 9, y > x, x \geq 0\)
Answer
\(x+y \leq 9\ldots(1)\)
\(y > x \ldots(2)\)
\(x \geq 0 \ldots(3)\)
The graph of the line, \( x+y=9, y=x \) and \( x=0 \) are drawn the figure below;
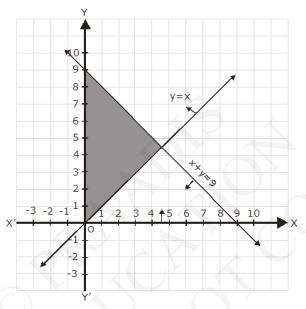
Inequalities (1) represents the region below the line, \( x+y=9 \) (including the line \( x+y=9) \) It is observed that \( (0,1) \) satisfies the inequalities \( {y} x \) \( [10] \)
Therefore, inequalities (2) represents \( [y=x] \).
Inequalities (1) represents the region on the right hand side of the line, \( x =0 \) or \( {y} \) - axis (including \( {y}\) - axis)
Hence, the solutions of the given system of linear inequalities is represent by the common shaded including the point on the lines, \( x+y= 9\) and \( {x}=0 \) and excluding the point on lines \( {y}={x} \) as follows.

9 Solve the following system of inequalities graphically: \(5 {x}+4 {y} \leq 20, {x} \geq 1, {y} \geq 2\)
Answer
\(5 x+4 y \leq 20 \ldots(1)\)
\(x \geq 1 \ldots(2)\)
\(y \geq 2 \ldots(3)\)
The graph of the line, \( 5 x+4 y=20, x=1 \) and \( y=2 \) are drawn the figure below;
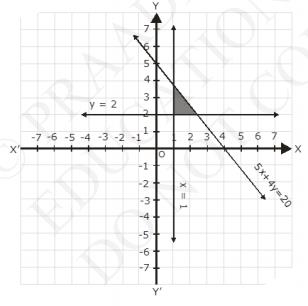
Inequalities (1) represents the region below the line, \( 5 x+4 y=20 \) (including the line \( 5 x+4 y=20 \))
Inequalities (2) represents the region on the right hand side the line, \( x= 1\) (including the line \( {x}=1 \))
Inequalities (3) represents the region above the line, \( y=2 \) (including the line \( y=2 \))
Hence, the solutions of the given system of linear inequalities is represent by the common shaded including the point on the respective lines as follows.
10. Solve the following system of inequalities graphically: \(3 x+4 y \leq 60, x+3 y \leq 30, x \geq 0, y \geq 0\)
Answer
\(3 x+4 y \leq 60 \ldots(1)\)
\(x+3 y \leq 30\ldots(2)\)
The graph of the line, \( 3 x+4 y=60 \) and \( x+3 y=30 \) are drawn the figure below;
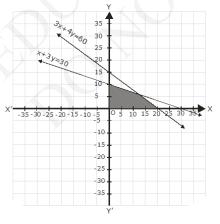
Inequalities (1) represents the region above the line, \( 3 x+4 y=60 \) (including the line \( 3 x+4 y=60 \))
Inequalities (1) represents the region above the line, \( x+3 y=30 \) (including the line \( x+3 y=30 \))
Since, \( x \ 0 \) and \( y \ 0 \), every point in the common shaded region in the first quadrant including the points on the respective lines and the axes represents the solutions of the given system of linear inequalities.
11. Solve the following system of inequalities graphically: \(2 x+y \geq 4, x+y \leq 3,2 x-3 y \leq 6\)
Answer
\(2 x+y \geq 4 \ldots(1)\)
\(x+y \leq 3 \ldots(2)\)
\(2 x-3 y \leq 6\ldots(3)\)
The graph of the line \( 2 x+y=4, x+y=3 \) and \( 2 x-3 y=6 \) are drawn the figure below;
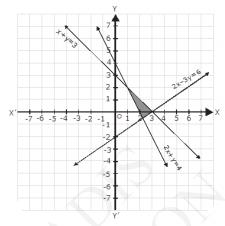
Inequalities (1) represents the region above the line, \( 2 x+y=4 \) (including the line \( 2 x+y=4 \))
Inequalities (2) represents the region below the line, \( x+y=3 \) (including the line \( x+y=3 \))
Inequalities (3) represents the region above the line, \( 2 x-3 y=6 \) (including the line \( 2 {x}-3 {y}=6 \))
Hence, the solutions of the given system of linear inequalities is represent by the common shaded including the point on the respective lines as follows.
12. Solve the following system of inequalities graphically: \(x-2 y \leq 3,3 x+4 y \geq 12, x \geq 0, y \geq 1\)
Answer
\(x-2 y \leq 3 \ldots(1)\)
\(3 x+4 y \geq 12\ldots(2)\)
\( {y} \geq 1\ldots(3)\)
The graph of the line \( x-2 y=3,3 x+4 y=12 \) and \( y=1 \) are drawn the figure below:
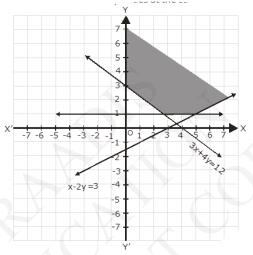
Inequalities (1) represents the region above the line, \( x-2 y=3 \) (including the line \( {x}-2 {y}=3 \))
Inequalities (2) represents the region above the line, \( 3 x+4 y=12 \) (including the line \( 3 {x}+4 {y}=12 \))
Inequalities (3) represents the region above the line, \( y=1 \) (including the line \( {y}=1 \))
Inequalities \( x \geq 0 \) represents the region on the right and side of \( y\) - axis (including \( {y} \) - axis)
Hence, the solutions of the given system of linear inequalities is represents by the common shaded region including the point on the respective lines and \( y \) - axis as follows.
class 11 maths ncert solutions chapter 6 || ncert solutions for class 11 maths chapter 6 || exercise 6.3 class 11 maths solutions || class 11 chapter 6 exercise 6.3 solution || class 11 maths exercise 6.3 solutions || ncert exemplar class 11 maths || class 11 ch 6 exercise 6.3 solutions || linear inequalities class 11 ncert solutions
13. Solve the following system of inequalities graphically: \(4 x+3 y \leq 60, y \geq 2 x, x \geq 3, x, y \geq 0\)
Answer
\(4 x+3 y \leq 60 \ldots(1)\)
\(y \geq 2 x \ldots(2)\)
\(x \geq 3 \ldots(3)\)
The graph on the lines, \( 4 x+3 y=60, y=2 x \), and \( x=3 \) are drawn the figure below;
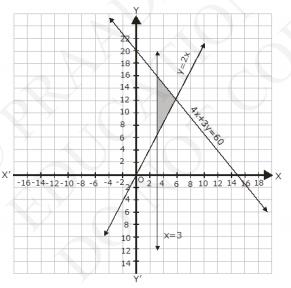
Inequalities (1) represents the region below the line, \( 4 x+3 y=60 \) (including the line \( 4 x+3 y=60 \))
Inequalities (2) represents the region above the line, \( y=2 x \) (including the line \( {y}=2 {x} \))
Inequalities (3) represents the region on the right hand side of the line, \( x \) \( =3 \) (including the line \( {x}=3 \))
Hence, the solutions of the given system of linear inequalities is represent by the common shaded including the point on the respective lines as follows.
14. Solve the following system of inequalities graphically: \(3 x+2 y \leq 150, x+4 y \leq 80, x \leq 15, y \geq 0, x \geq 0\)
Answer
\(3 x+2 y \leq 150 \ldots(1)\)
\(x+4 y \leq 80 \ldots(2)\)
\(x \leq 15 \ldots(3)\)
The graph of the lines \( 3 x+2 y=150, x+4 y=80 \) and \( x=15 \) are drawn in the figure below;
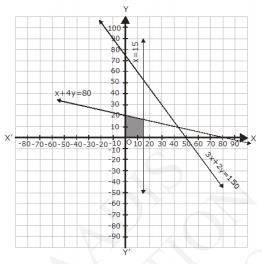
Inequality (1) represents the region below the line, \( 3 x+2 y=150 \) (including the line \( 3 {x}+2 {y}=150 \))
Inequality (2) represents the region below the line, \( x+4 y=80 \) (including the line \( {x}+4 {y}=80 \))
Inequality (3) represents the region on the left side the line, \( x=15 \) (including the line \( {x}=15 \))
Since, \( x \ 0 \) and \( y \ 0 \), every point in the common shaded region in the first quadrant including the points on the respective lines and the axes represents the solutions of the given system of linear inequalities.
15. Solve the following system of inequalities graphically: \(x+2 y \leq 10, x+y \geq 1, x-y \leq 0, x \geq 0, y \geq 0\)
Answer
\(x+2 y \leq 10\ldots\text{(i)}\)
\(x+y \geq 1 \ldots\text{(ii)}\)
\( x-y \leq 0\ldots\text{(iii)}\)
The graph of the lines, \( x+2 y=10, x+y=1 \) and \( x-y=0 \), are drawn in the figure below.
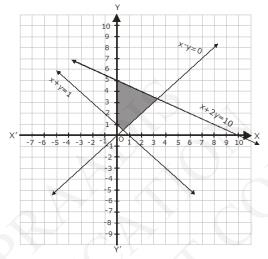
Inequality (1) represents the region below the line, \( x+2 y=10 \) (including the line \( {x}+2 {y}=10 \)).
Inequality (2) represents the region above the line, \( x+y=1 \) (including the line \( {x}+{y}=1 \))
Inequality (3) represents the region above the line, \( x-y=0 \) (including the line \( x-y=0 \))
Since, \( x \ 0 \) and \( y \ 0 \), every point in the common shaded in the first quadrant including the point on the respective lines and the axes represent the solution of the given system of linear inequalities.